The vCloud Director billing system now includes an infrastructure cost graph to help customers easily track their infrastructure costs. To view an infrastructure cost graph, open the More tab in vCloud Director and open the Billing tab.
This is how billing looked before.

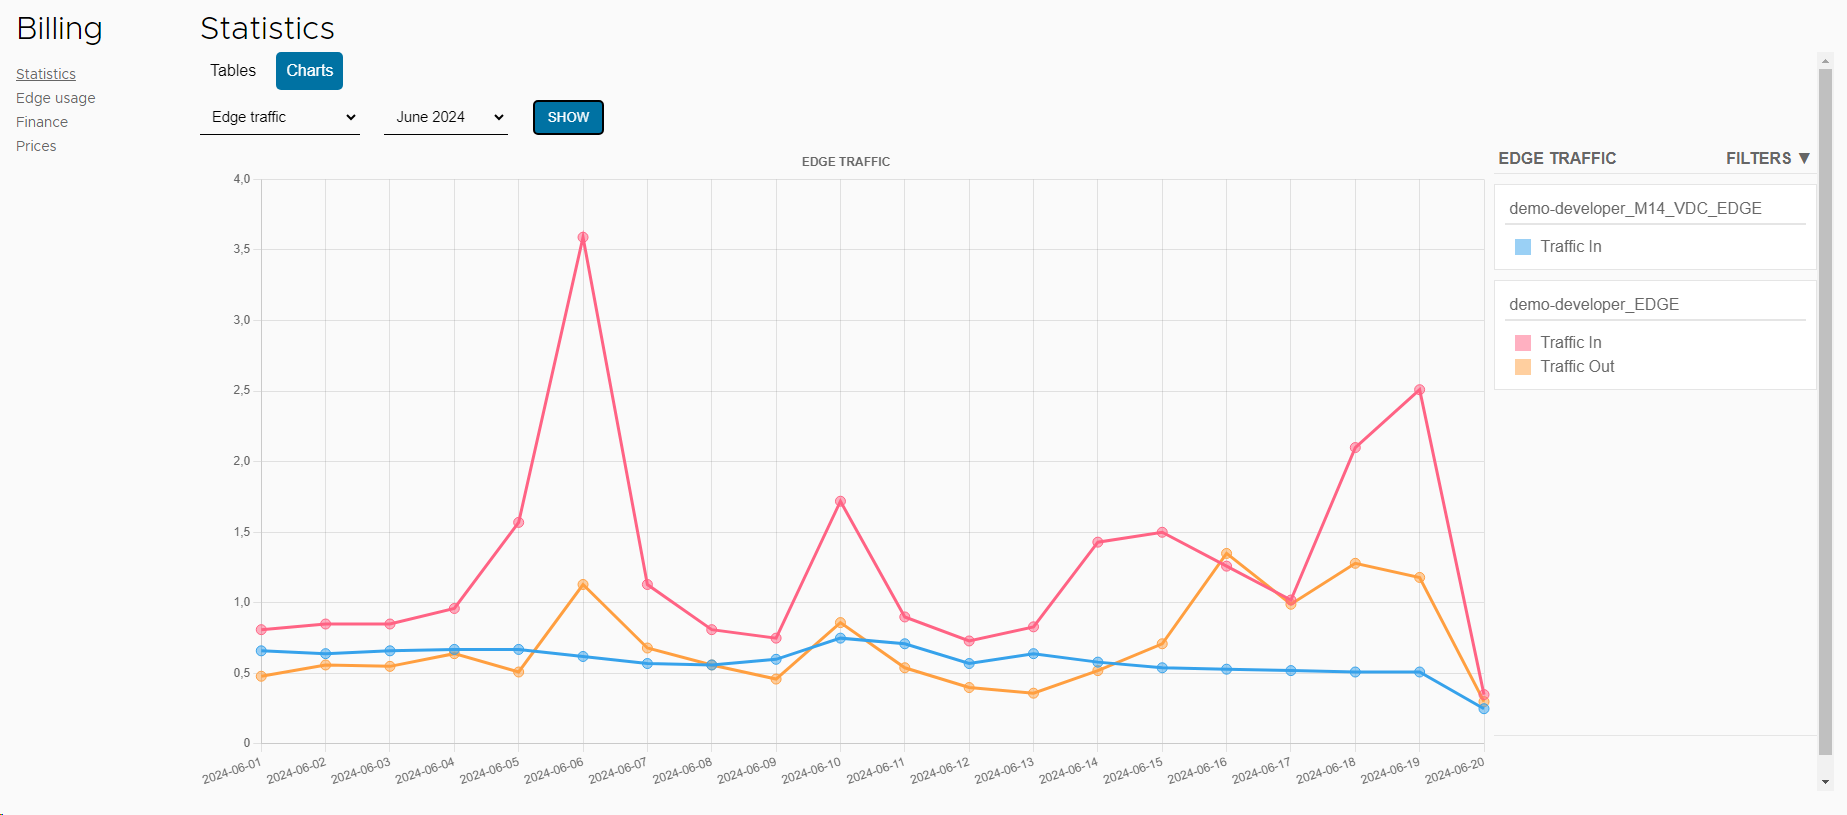
How it looks now.
View of the data from the graphs:

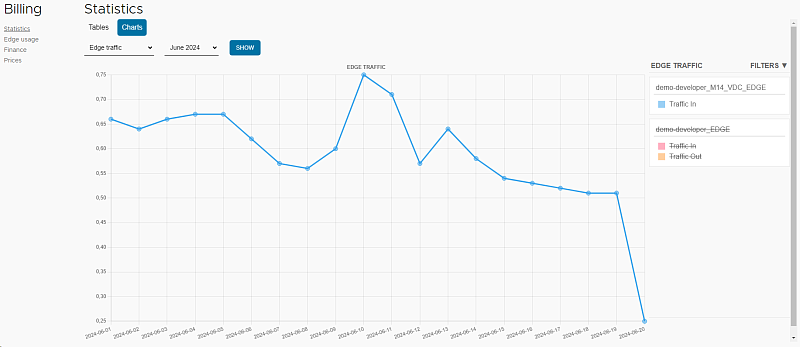
An example of hiding data on a graph:

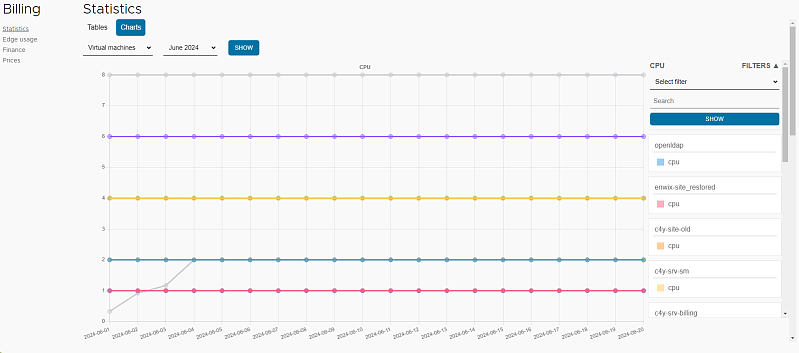
Graph for all machines:

The new cost graph shows detailed information about customers' infrastructure costs, including the cost of resource usage, memory and storage. Customers can see and analyse their expenses in real time.
The dashboard has been developed in response to our customers' requests for greater visibility into their infrastructure costs. We hope it will make budget management easier and help customers optimise their spend.


